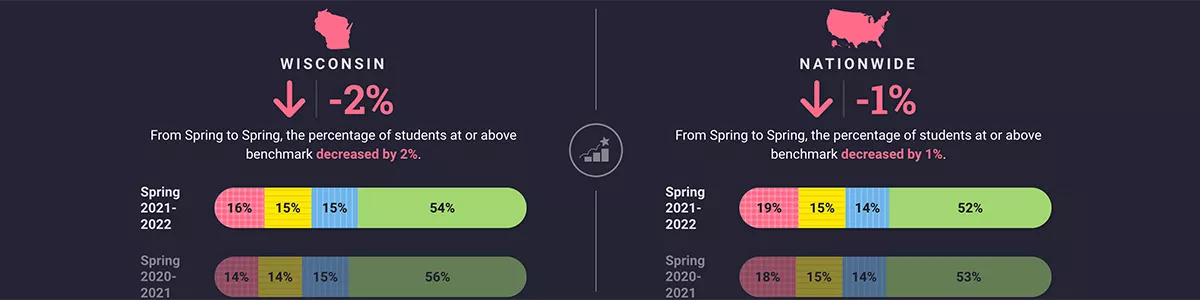
We made these visualizations for Renaissance. They show student performance by state as relative to benchmarks, and they show state performance in relation to nationwide performance.
Anachronism Press Case Study
How Kids Are Performing
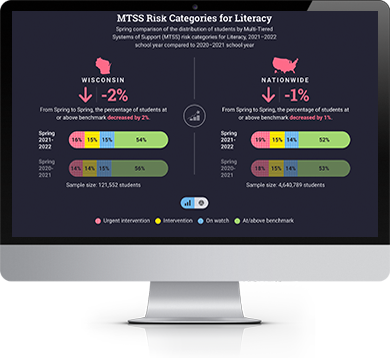
The report provides a year-over-year snapshot of student performance in literacy and math
The firewall on this server is blocking your connection.
You need to contact the server owner or hosting provider for further information.
Your blocked IP address is: 198.54.114.91
The hostname of this server is: server72.web-hosting.com
You can try to unblock yourself using ReCAPTCHA:
Please note: Not all unblock requests will be successful as it is dependent on how your IP address is being blocked. If the unblock fails you will need to contact the server owner or hosting provider for further information.
Project challenge
Build easily understood visualizations showing student performance.
Our solution
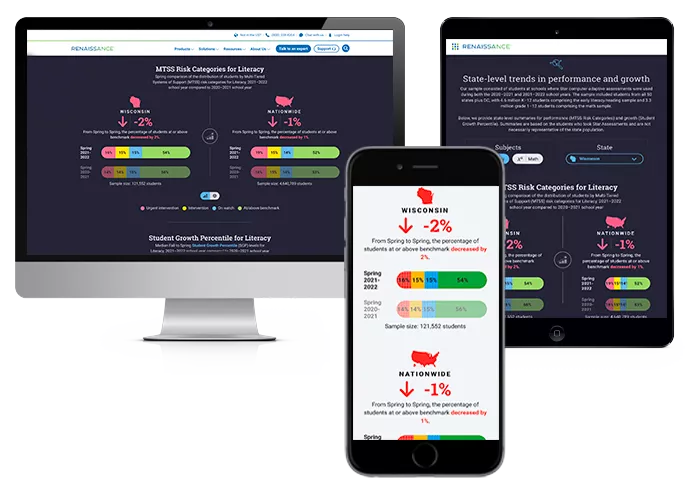
Here are the visualizations on desktop, tablet, and mobile.